By clicking “Accept All Cookies”, you agree to the storing of cookies on your device to enhance site navigation, analyze site usage and assist in our marketing efforts.
By clicking “Accept All Cookies”, you agree to the storing of cookies on your device to enhance site navigation, analyze site usage and assist in our marketing efforts.
How to Choose Your First Enterprise Knowledge Graph Use Case
Identify valuable use cases and build focused, measurable knowledge graph solutions.
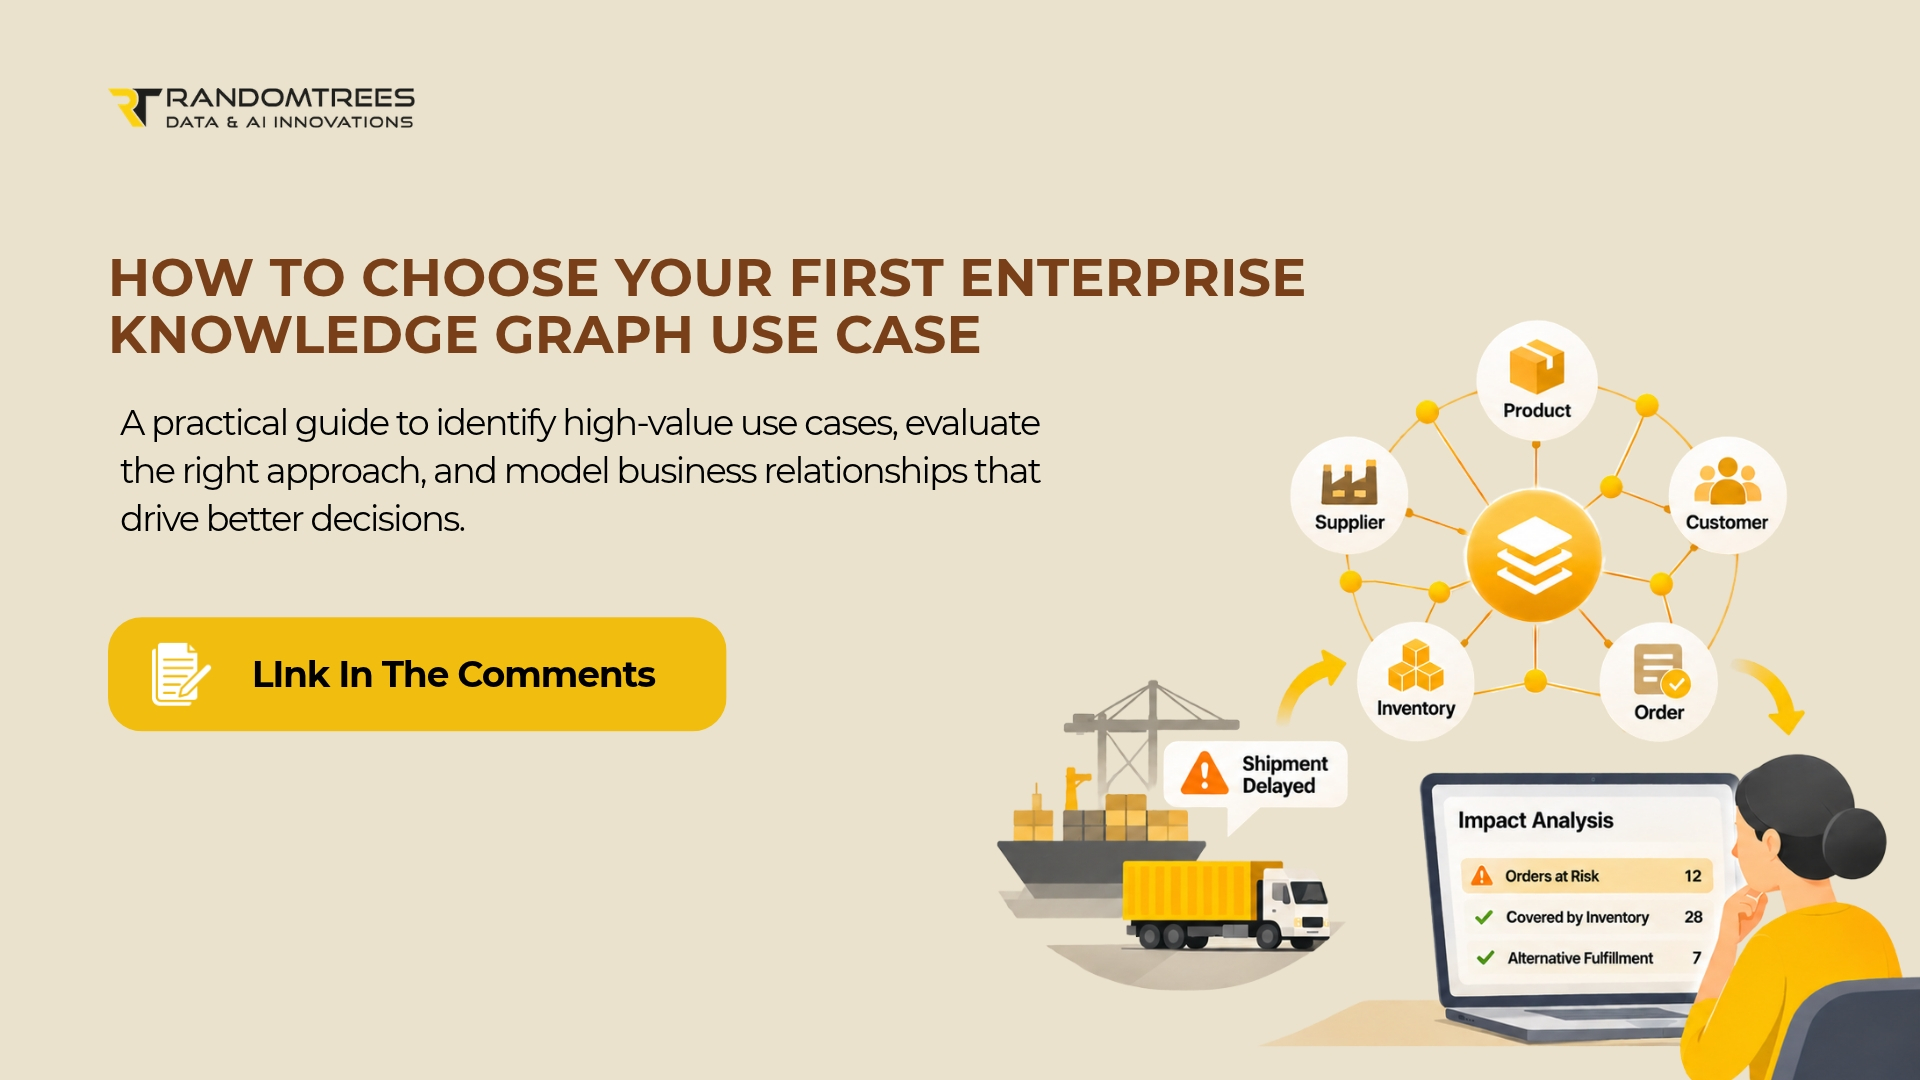
A supplier reports a delayed shipment. The supply chain team has until the afternoon cutoff to identify which customer orders are at risk.
A product lookup identifies every open order containing the affected item. But that list doesn't tell the planner which orders actually depend on the delayed shipment.
Some orders are covered by existing inventory. Others have allocations against incoming stock. A few may be fulfilled from alternative locations.
Finding the answer requires more than connecting records. The planner must establish which relationships are valid, what those relationships mean, and whether they are current enough to support a decision.
This is where an enterprise knowledge graph may create value.
But there is an important qualification: a knowledge graph is worth building only when representing and traversing business relationships offers a meaningful advantage over simpler data approaches.
That distinction should determine your first use case.
Start with the decision, then evaluate the technology
An enterprise knowledge graph connects business entities through explicitly defined relationships, making it possible to explore how customers, products, suppliers, assets, transactions, and processes relate to one another.
However, not every cross-system data problem requires a graph.
In its May 2024 research, *How to Evaluate the Applicability of Knowledge Graphs for Your Use Cases*, Gartner identifies complex relationships and semantic connections as strong reasons to consider knowledge graphs, while recognizing the suitability of traditional databases for simpler factual queries.
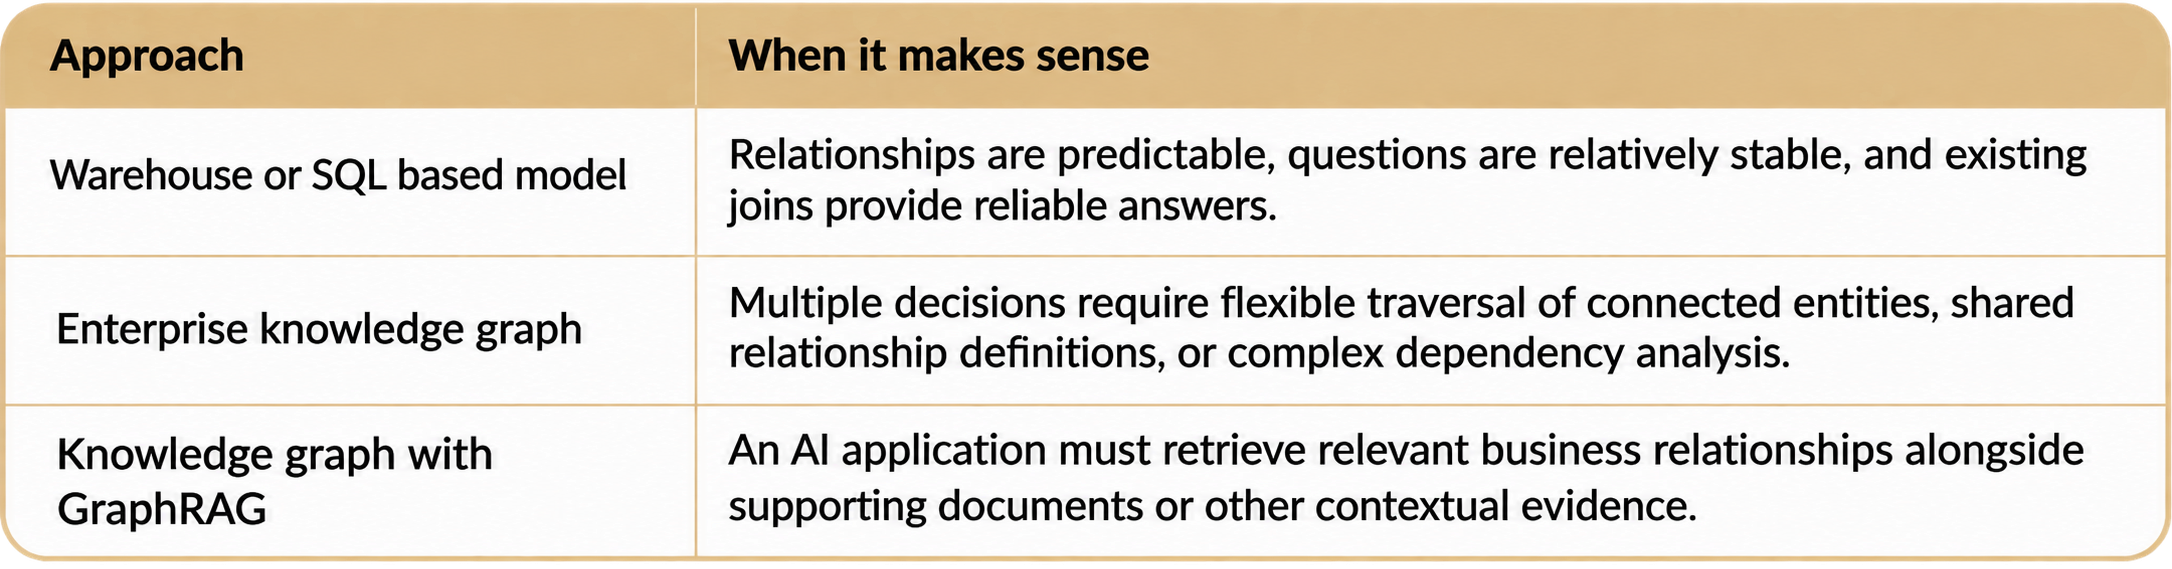
For enterprise teams, the first evaluation should compare three approaches:
A warehouse may be sufficient to identify affected orders through established joins. A graph becomes more compelling when planners, service teams, and other applications need to follow different paths through those same relationships.
For example, a planner might trace a delayed shipment forward to affected customers. A service agent might start with a customer order and trace backward to the shipment responsible for the delay.
The potential advantage is the reuse of a consistent relationship model across different business questions.
Before selecting a graph, establish what it will do better than the simplest viable alternative.
Identify a business decision where relationships change the answer
Start by interviewing the person accountable for an operational decision.
Ask them to reconstruct a recent case:
What triggered the decision?
Which systems and records did they consult?
Which relationships did they verify manually?
Where did uncertainty slow the process?
What action followed?
How long did they have to respond?
These questions help distinguish an interesting data problem from a valuable implementation opportunity.
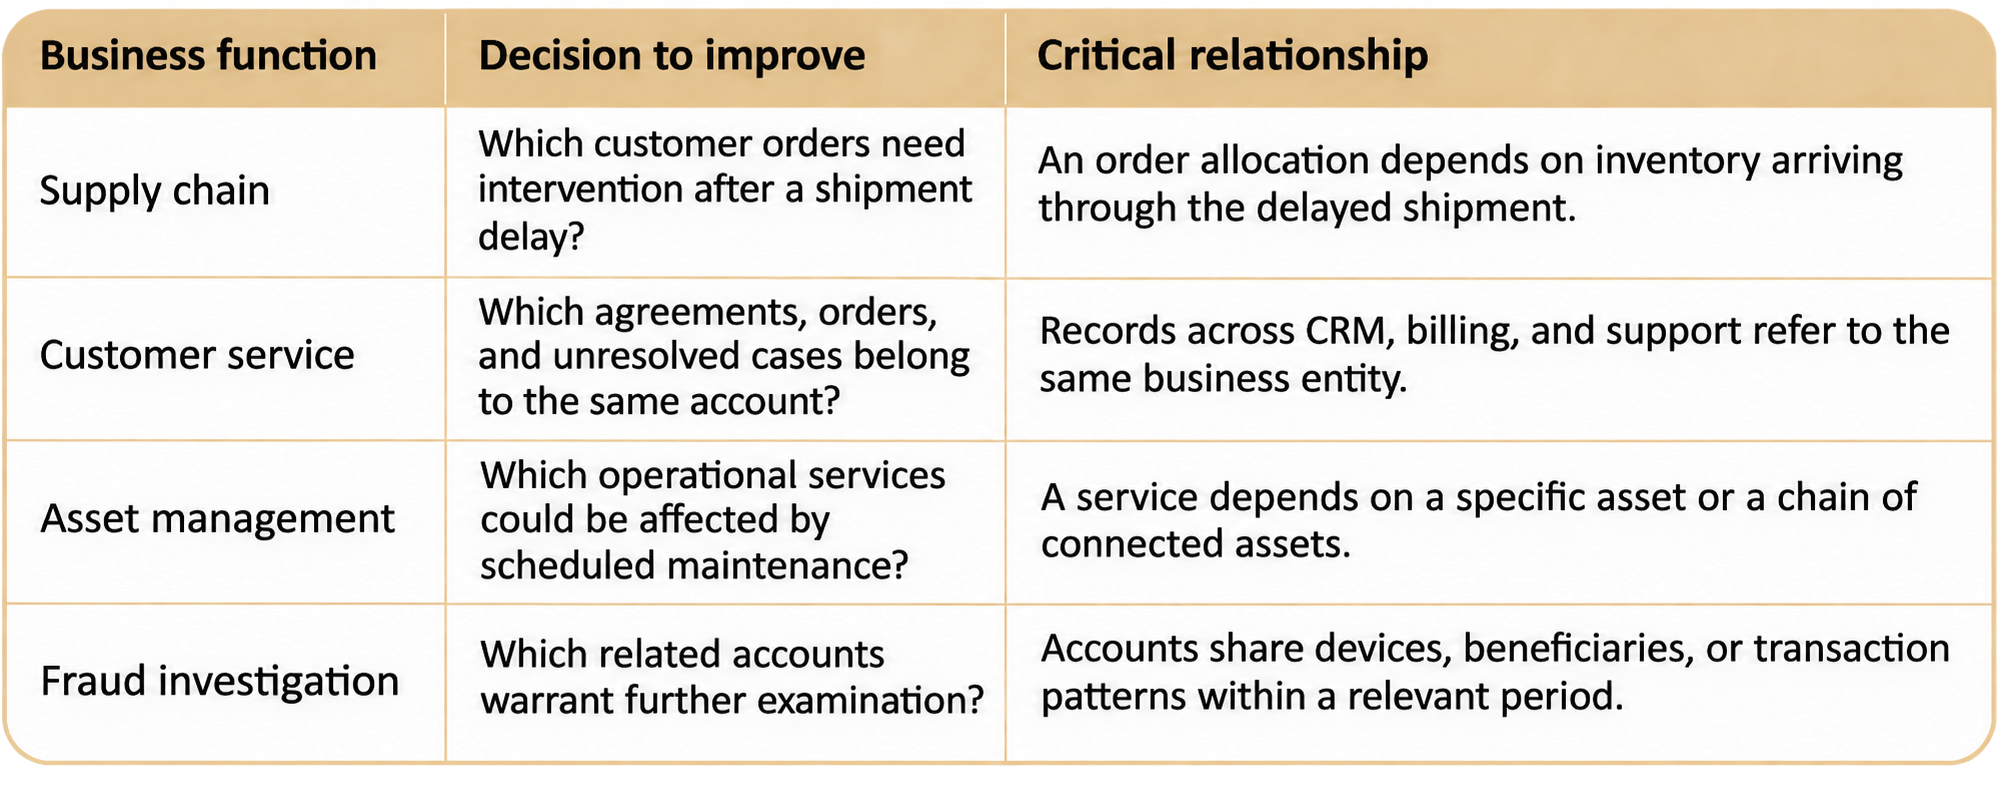
Consider four potential enterprise knowledge graph use cases.
The shared characteristic is that the relationship changes what someone investigates, prioritizes, or acts upon.
Still, the existence of a relationship does not establish the accuracy or significance of a conclusion.
A shared device may justify investigating related accounts without proving fraud. A delayed shipment may indicate possible order exposure without confirming a missed delivery.
The graph must preserve those distinctions.
Model the relationship at the level of certainty the decision requires
Return to the supply chain example.
A basic graph may establish that a delayed shipment contains a product associated with several open orders.
That identifies possible exposure.
To determine which orders require intervention, the graph may need additional relationships connecting shipments, received or expected inventory, allocation records, fulfillment locations, and order lines.
It also needs the attributes that determine whether the relationship is meaningful:
Quantity: How much stock is allocated to the order?
Location: Which fulfillment facility is responsible?
Time: Was the allocation valid when the disruption occurred?
Availability: Could existing or alternative inventory satisfy the demand?
Evidence: Which source record establishes the relationship?
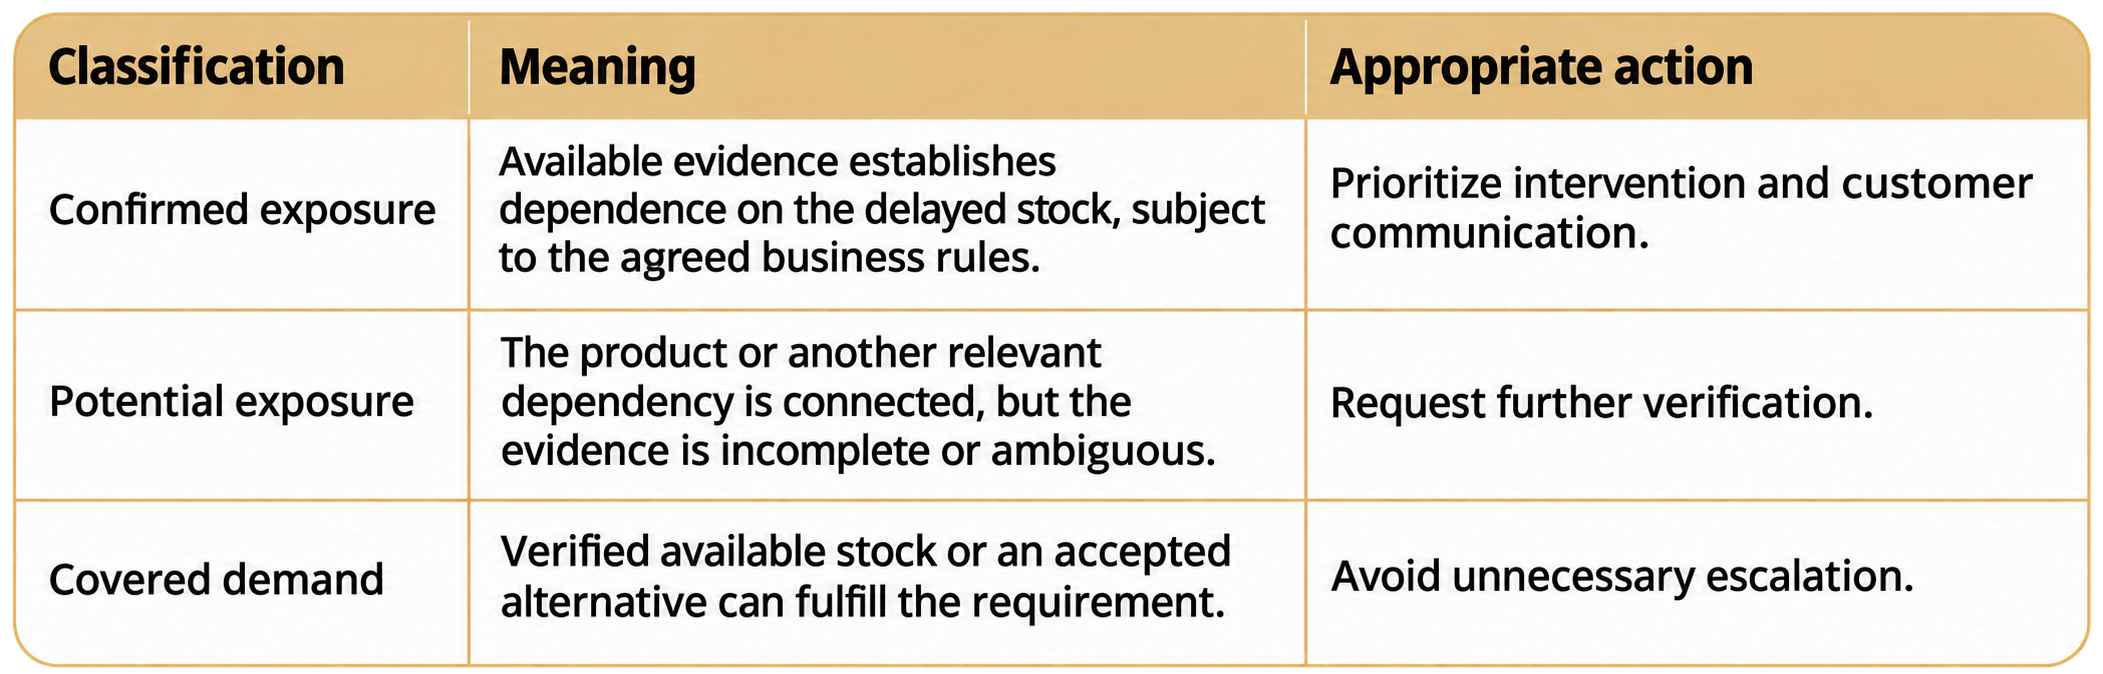
This allows the application to distinguish three useful states:
These categories are an illustrative design proposal, not an industry standard.
The model must reflect the organization's actual allocation rules and operational definitions.
Importantly, graph technology does not repair incorrect source data. It can make relationships easier to traverse, but incorrect identifiers, outdated allocations, and missing events can still produce incorrect conclusions.
That is why the first implementation should focus on a small number of decision-critical relationships rather than attempting to connect every enterprise dataset.
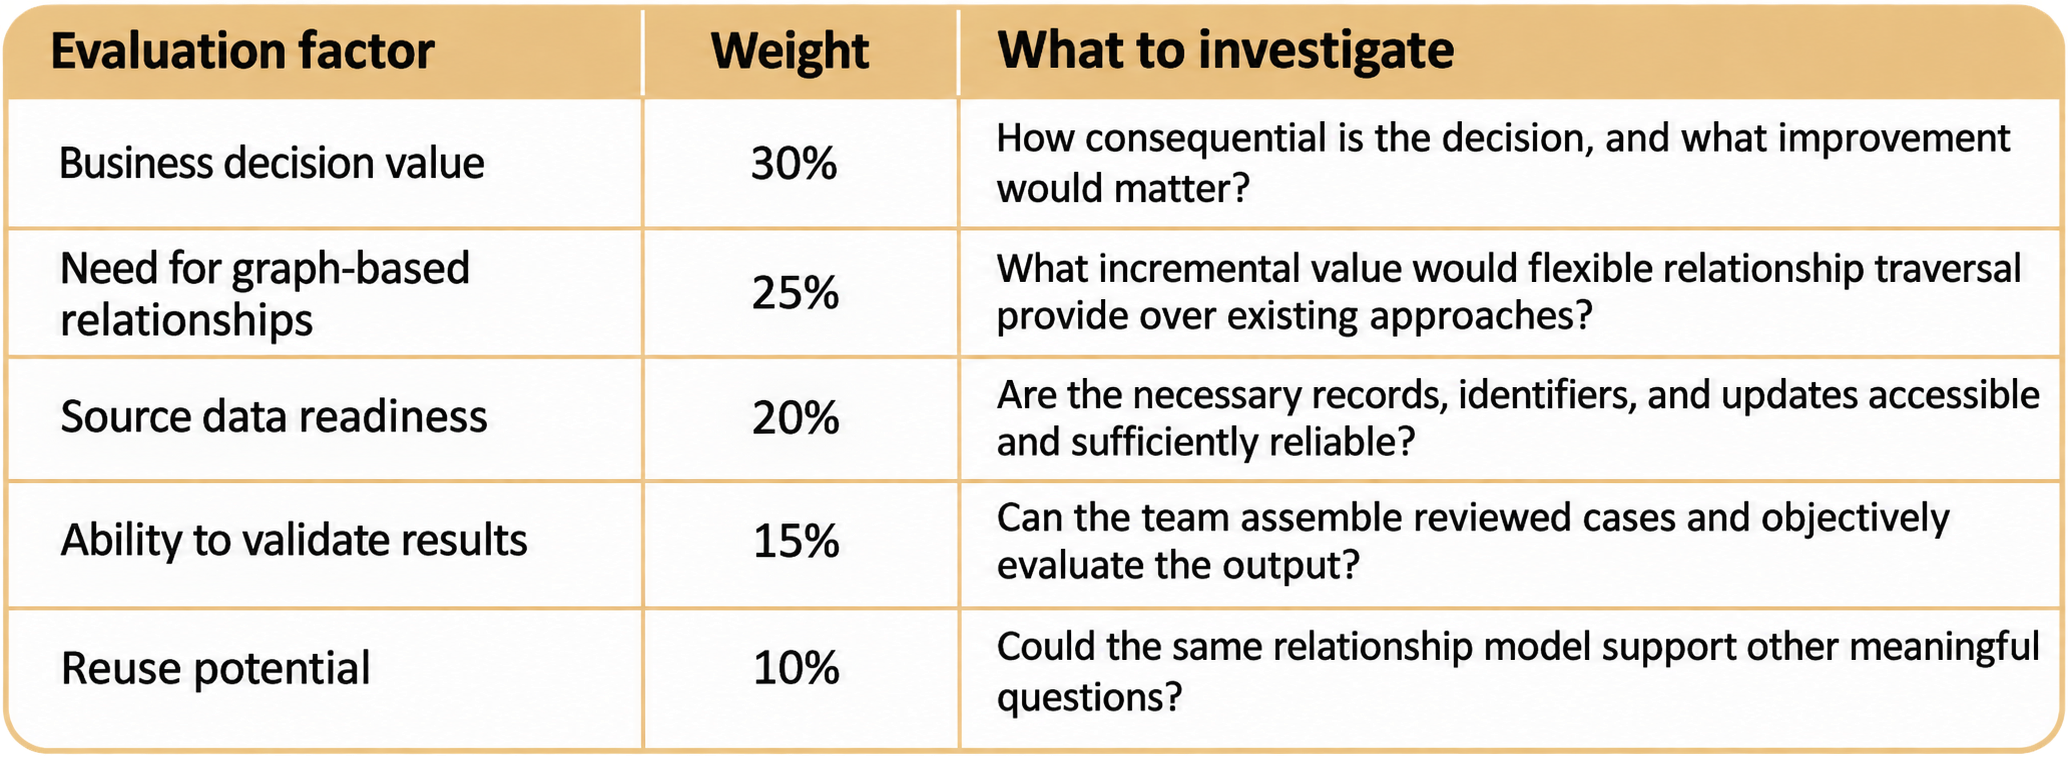
Prioritize your first use case with a five-factor scorecard
Once several candidates are identified, evaluate them using a consistent framework.
The following scorecard is a proposed prioritization method for enterprise pilots. Its weights are illustrative and should be adjusted to the organization's priorities.
Score each factor from 1 to 5:
1: Weak or largely unproven.
3: Plausible, with identifiable limitations.
5: Strong, supported by concrete evidence
Calculate the weighted score by multiplying each factor's weight by its rating divided by five.
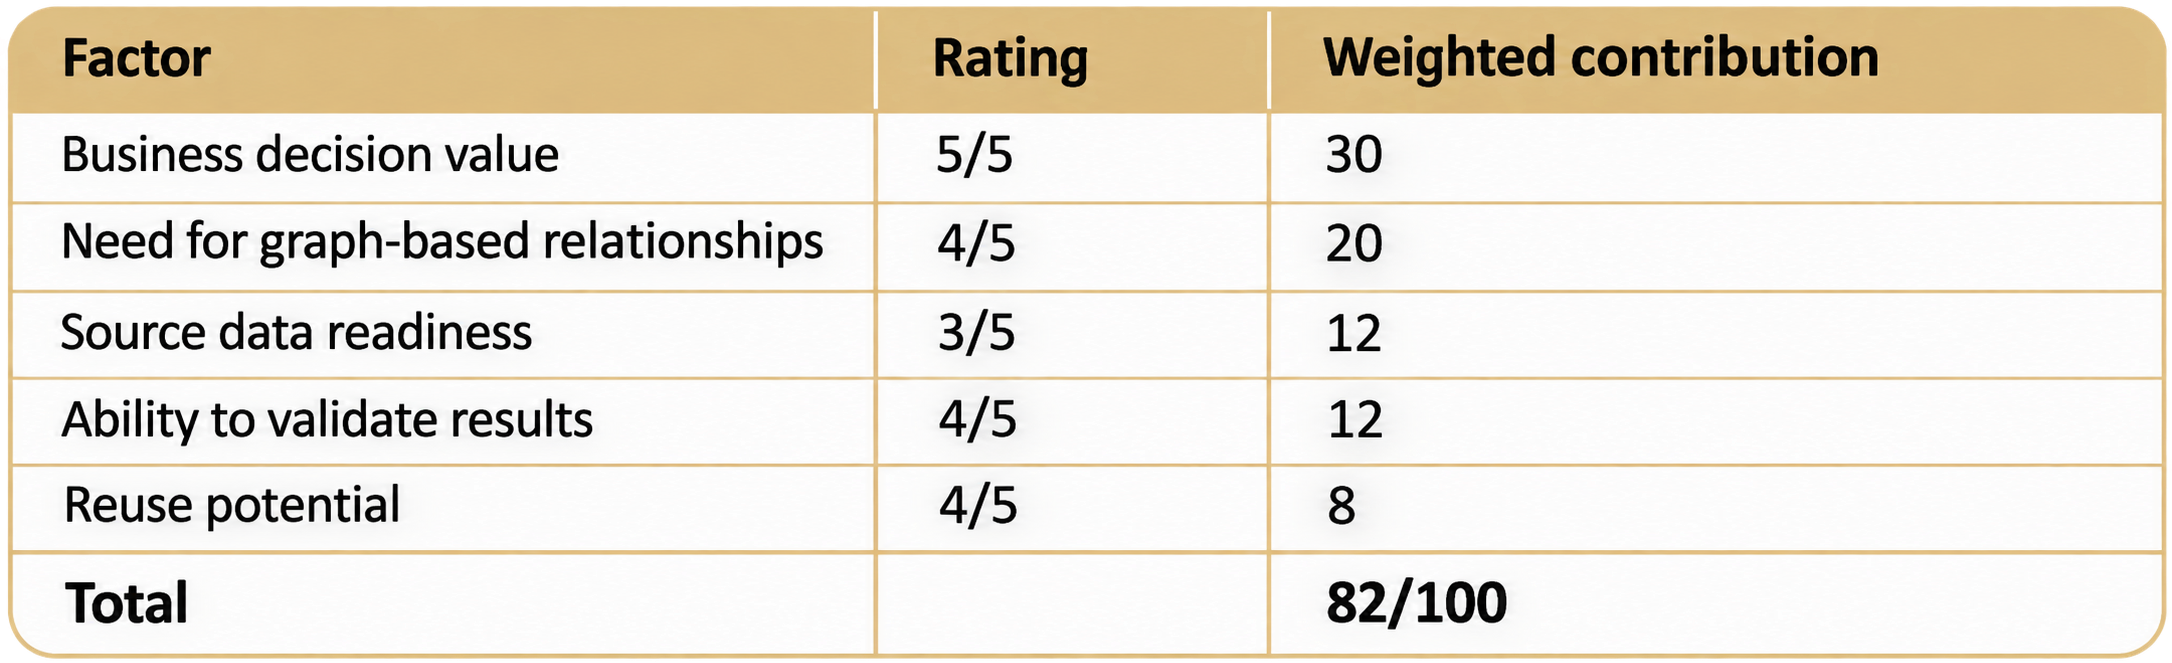
Example: Shipment disruption analysis
Suppose the team evaluates a shipment-impact use case and assigns the following hypothetical ratings:
A score of 82 suggests a promising candidate relative to alternatives assessed using the same criteria. It does not establish that the project will succeed or that a graph is warranted.
Before approving the pilot, require four things:
1. A named business owner accountable for the decision.
2. A clearly articulated advantage to test against the existing data approach.
3. Access to the minimum source records necessary to evaluate the result.
4. A baseline and reviewed examples against which the pilot can be measured.
If the graph advantage is weak, test an existing warehouse solution first.
If a critical source is unavailable, treat source remediation as a prerequisite rather than assuming graph implementation will compensate for it.
The scorecard is most useful for comparing viable candidates, not bypassing these requirements.
Build the smallest graph that can answer the question
A pilot does not need a comprehensive enterprise ontology or a wholesale replacement of the existing data platform.
Start with the relevant source systems and the smallest useful set of entities and relationships.
For the shipment-impact example, that may involve:
Entities: Shipment, Inventory Lot, Allocation, Order Line, Fulfillment Location, Customer.
Relationships: Contains, Supplies, Allocated To, Fulfilled From, Ordered By.
Decision attributes: Quantities, timestamps, allocation status, location, and source identifiers.
The engineering effort should concentrate on four areas.
1. Resolve identities across systems
A shipment identifier in a logistics platform may not align directly with the identifiers used by warehouse or order management systems.
Define how records are matched, how conflicting identities are resolved, and which ambiguous matches require human review.
2. Validate relationships against operational cases
Use reconciled examples to establish whether the model correctly handles partial allocations, split shipments, alternative fulfillment, cancellations, and changing commitments.
Relationship accuracy matters more than the number of entities represented.
3. Preserve source evidence and time
For decision-critical relationships, retain the originating record, relevant event time, processing or refresh time, and derivation logic.
The W3C PROV-O specification provides a standardized vocabulary for describing provenance, including entities, activities, and derivations. It is one option for representing evidence lineage, rather than a mandatory technology choice for every graph.
Apply access controls so users and AI applications only retrieve records they are authorized to see.
4. Assign operational ownership
Determine who maintains identity rules, reviews uncertain relationships, monitors data freshness, and resolves failed updates.
A technically functional graph can still become unreliable if nobody owns the correctness of its underlying relationships.
The first pilot should establish these responsibilities before expanding its scope.
Prove the value against the existing process
The most convincing justification for a knowledge graph is a measurable improvement against a credible alternative.
Run the proposed graph-based workflow and the simplest viable existing approach against comparable test cases.
For the shipment scenario, replay historical disruptions using only information that would have been available at the original decision time.
This avoids giving the pilot knowledge of events that occurred later.
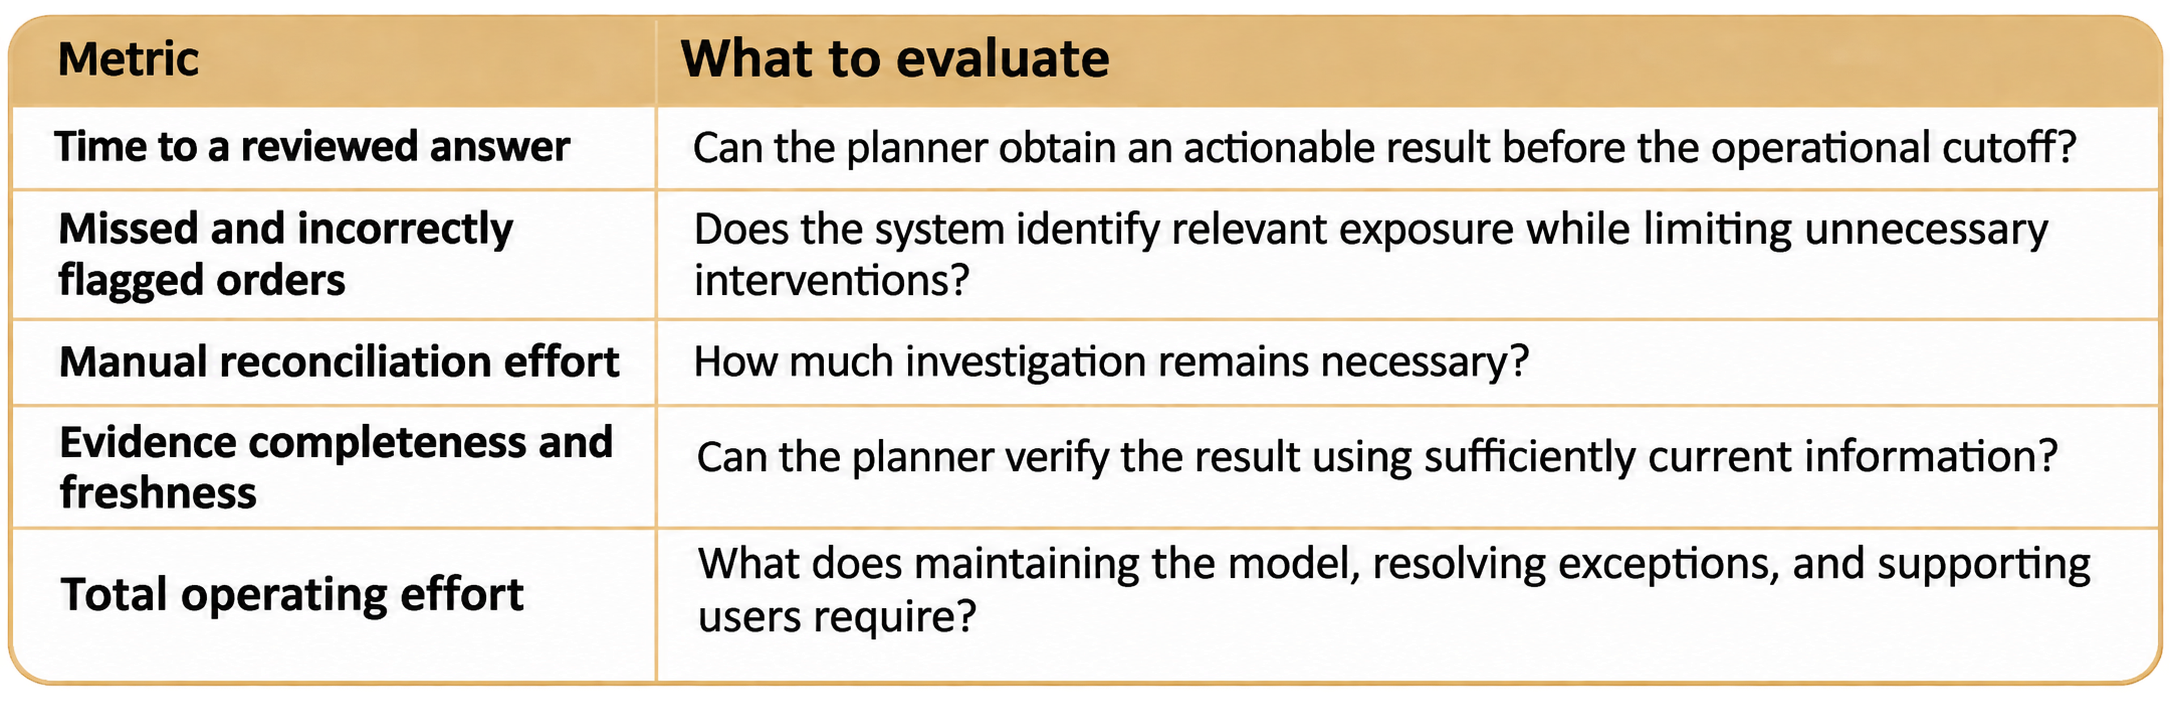
Use a reviewed reference set to identify the orders that actually required intervention. Include ambiguous allocations, conflicting records, partial fulfillment, and delayed source updates.
Measure five dimensions.
Define acceptable error limits before running the test. A quicker answer that misses critical orders may be less valuable than a slower, more reliable one.
Also evaluate whether an existing warehouse model can deliver comparable results at lower implementation and maintenance cost.
If it can, the business may not need a graph for that workflow.
If the graph produces a meaningful improvement, investigate whether the same relationship definitions can support additional questions without extensive reengineering.
That reuse is one of the strongest reasons to consider a knowledge graph beyond the first pilot.
What existing implementations tell us
Enterprise knowledge graphs are already being applied to supply chain visibility and relationship-based analytics, although published results vary in detail.
In October 2024, Gartner published a case study of Cencora's supply chain knowledge graph, reporting that the implementation enabled faster and more detailed analytics. The public abstract does not provide numerical performance benchmarks.
Infosys reports improved visibility and reduced manual planning effort. These are vendor-reported outcomes, not independently verified performance estimates.
Both examples support the relevance of connected relationship models to supply chain operations. Neither establishes that every organization will achieve similar results or that a graph will outperform its existing architecture.
The lesson for a first pilot is to prove the business advantage under the organization's own data conditions and operational constraints.
Extend verified relationships into enterprise AI
Once a relationship model is reliable, it can provide structured context for enterprise AI applications.
Consider a planner asking:
"Why is customer order 4582 at risk?"
A knowledge graph could retrieve the relevant order, allocation, inventory, and shipment dependencies.
A retrieval system could separately retrieve the carrier's delay notification or operating procedures.
An AI application could combine those results to explain the potential disruption and cite the supporting records.
This pattern is commonly associated with GraphRAG, where graph relationships complement retrieval-augmented generation.
However, adding an AI assistant introduces further requirements: response validation, appropriate access control, handling stale information, and retaining human review for consequential decisions.
A graph can support a better-evidenced response. It does not guarantee that every generated explanation will be correct.
For that reason, the first milestone should remain the quality of the underlying business relationships, not the sophistication of the AI interface.
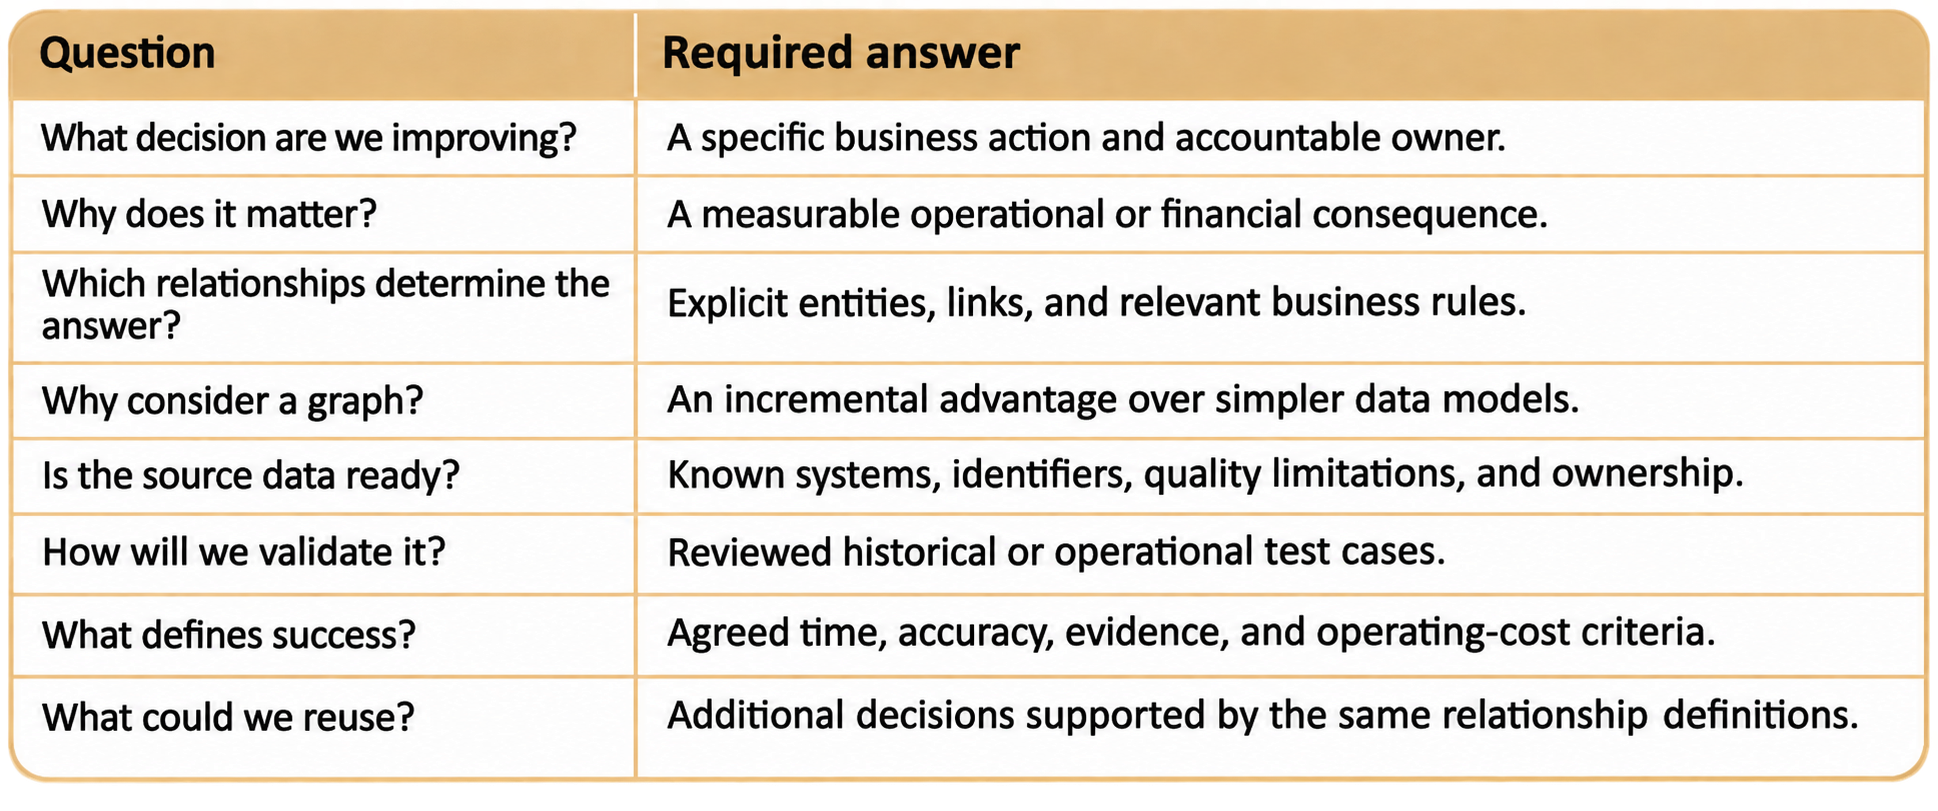
A practical worksheet for choosing your first use case
Before approving an enterprise knowledge graph pilot, document the following with the business and engineering teams.
For the shipment-impact scenario, success means identifying orders dependent on delayed stock, showing the supporting evidence, and giving planners enough time to act, while meeting agreed accuracy and cost requirements.
That is a bounded engineering problem with a measurable business result.
The first enterprise knowledge graph should earn its place by improving one important decision. Its broader value emerges when the verified relationships can support many more.
From use-case selection to implementation
At RandomTrees, our Data Engineering Services help organizations build reliable and scalable data foundations through enterprise data integration, data engineering, data quality and solution architecture.
Implementing an enterprise knowledge graph starts with understanding how business data connects across systems, establishing trusted relationships, and ensuring the underlying data is ready to support meaningful business decisions. Our data engineering expertise helps organizations assess these foundations and explore practical approaches to building connected, governed and AI-ready data ecosystems.
Bring one candidate workflow and a recent operational example to explore what a focused, evidence-driven pilot would require.