

This article will explain the facilitative role of PostgreSQL in enhancing organizations’ data analysis capabilities and extracting valuable insights, particularly when integrated with Informatica. The selection of a robust platform is crucial for managing diverse workloads without experiencing performance degradation, and PostgreSQL emerges as an excellent choice for handling substantial data volumes effectively.
Informatica PowerCenter plays a pivotal role in optimizing performance through parallel processing, which entails distributing the workload across multiple threads or sessions. Parallel processing can be activated at different levels, including source, target, and transformations, thereby contributing to enhanced efficiency in data processing.
Introduction to Informatica Performance Tuning
- In today’s data-driven world, optimizing and maximizing the performance of a Informatica job is crucial for organizations looking to leverage their data effectively.
- The primary objective of performance tuning is to enhance session performance by systematically removing performance bottlenecks.
- To fine-tune session performance, the iterative process involves identifying a performance bottleneck, addressing it, and subsequently moving on to the next bottleneck until the desired session performance is achieved.
- The incorporation of partitions can significantly enhance performance by leveraging more of the system hardware during session processing.
- This presentation will delve into essential strategies and techniques aimed at achieving optimal efficiency in the context of Informatica performance tuning
Identifying Performance Bottlenecks in Informatica
- The identification of performance bottlenecks holds paramount importance in the pursuit of maximizing efficiency within Informatica. This process enables organizations to precisely locate areas causing slowdowns and take necessary measures to optimize them. Addressing these bottlenecks not only improves overall performance but also accelerates data processing, leading to optimal outcomes.
- When searching for performance bottlenecks, it is advisable to follow a structured order:
- a) Target
- b) Source
- c) Mapping
- d) Session
Various methods can be employed to identify performance bottlenecks, including:
- Running test sessions: Configuring test sessions to read from a flat file source or write to a flat file target helps identify source and target bottlenecks.
- Analyzing thread statistics: Examining thread statistics aids in determining the optimal number of partition points by identifying source, target, or transformation bottlenecks.
- Thread statistics in the session log offer valuable insights:
- Run time: Indicates the duration of thread execution.
- Idle time: Represents the time a thread remains inactive, including wait times for other thread processing.
- Busy time: This percentage, calculated as – [{(run time – idle time) / run time} x 100]
This identifies the time the thread is actively processing. However, high busy percentages in short total run times, such as under 60 seconds, may not necessarily indicate a bottleneck and can be disregarded
Partitioning
- Partitioning is a pivotal process involving the division of data and processing tasks into smaller subsets, known as partitions, with the aim of enhancing performance and scalability during data integration operations. This approach facilitates parallel processing of data, contributing to improved efficiency.
- Parallel processing, a key aspect of data handling, enables swifter execution and enhanced performance, especially when dealing with substantial volumes of data. Informatica incorporates parallel processing across various components, including mapping, session, and workflow.
Types of Partitioning
Adding partitions is a beneficial strategy to enhance performance by effectively leveraging the system hardware during session processing.
Database partitioning
- Utilized for relational systems like Oracle, PostgreSQL and IBM DB2 sources targets.
- Accommodates any number of pipeline partitions and database partitions.
- Performance improvement is notable when the number of pipeline partitions aligns with the number of database partitions. Utilized for Oracle and IBM DB2 sources targets.
Pass-through
- Integration Service processes data without redistributing rows among partitions.
- Suitable when an additional pipeline stage is desired for performance enhancement, without altering the distribution of data across partitions.
- Particularly useful when employing query override in source qualifier.
Example:
Key Range Partitioning
- The Server distributes rows of data based on a port or set of ports that specified as partition key. For each port, define a range of values.
Round-Robin
- In Round-Robin partitioning, the Integration Service uniformly distributes rows of data across all partitions. Each partition processes approximately an equal number of rows. This method ensures an even distribution of workload among partitions, promoting balanced processing.
Hash partitioning
- Hash partitioning is advantageous when you want the PowerCenter Integration Service to distribute rows to partitions based on grouping. For instance, when sorting items by item ID, and the number of items with a particular ID is unknown.
Types of Hash Partitioning:
- Hash Auto-Keys: The Integration Service utilizes all grouped or sorted ports as a compound partition key. Applicable in transformations such as Rank, Sorter, and unsorted Aggregator.
- Hash User Keys: The Integration Service employs a hash function to group rows of data among partitions. The number of ports to generate the partition key is defined by the user.
What Is PostgreSQL Performance Tuning?
Optimizing PostgreSQL performance involves adjusting the configuration settings to enhance the database’s efficiency. This task necessitates a comprehensive comprehension of the database’s functioning, the purpose of each configuration parameter, and the appropriate values to be applied.
The methods for tuning a PostgreSQL database’s performance vary widely and are contingent upon the specific use case. Therefore, it is crucial to establish clear performance objectives before initiating the tuning process. Numerous configuration parameters are available for tuning, and this section will delve into a discussion of some key ones.
-
Database Design
Crafting the database design stands out as a pivotal phase in enhancing the overall performance of a database. Leveraging PostgreSQL’s relational database features, it becomes feasible to partition data across multiple logically distinct tables rather than consolidating everything into a single extensive table. Typically, this approach yields prompt and substantial enhancements in query performance.
Another straightforward and prevalent strategy to optimize PostgreSQL performance involves ensuring an adequate presence of indexes. The effectiveness of this tactic is heavily contingent upon the specific use case and the nature of frequently executed queries.
While indexes contribute positively to query performance improvement, exercising caution is imperative. Excessive reliance on indexes can lead to adverse effects, underscoring the need for a balanced and thoughtful approach in their application.
Database Configuration Parameters Tuning
PostgreSQL comes with a lot of configuration parameters to optimize performance.
-
Connection Configuration Parameters
The parameter max_connections plays a crucial role in shaping the behavior of both PostgreSQL server and client connections. Its purpose is to set the upper limit on the number of concurrent connections that a PostgreSQL server can handle. The formula for this calculation is:
max_connections = max (4×number of CPU cores,100)
This formula ensures that the PostgreSQL server can manage a maximum number of parallel connections without overburdening the CPU with an excessive load. However, it is equally essential to ensure that the hardware resources available are sufficient to support the specified quantity of parallel connections. Balancing these considerations is vital for optimal performance and resource utilization in a PostgreSQL environment.
Query Performance Tuning
Understanding how PostgreSQL executes queries is crucial for optimizing query performance and, if necessary, fine-tuning the database. Several commands and techniques can be employed to check and enhance query performance.
-
ANALYZE
The “analyze” command in PostgreSQL is employed to run statistical measurements on databases and tables, generating calculated statistics stored in a PostgreSQL-maintained table. These statistics are then utilized by the query planner to enhance the planning of query execution.
-
EXPLAIN
Following the “analyze” command, the next logical step in PostgreSQL query performance tuning is the “explain” command. This command reveals the execution plan formulated by the database, utilizing the statistics obtained from the “analyze” command. The output provides valuable insights into the expected performance of the query, detailing whether it will utilize an index scan or a table scan, among other considerations.
-
Indexing Performance
In the realm of query performance, indexing holds paramount importance. The presence or absence of indexes can lead to a substantial disparity in query performance. However, this is contingent upon various factors, including the table size, data access patterns, and the indexing algorithm employed. Understanding how indexing influences query performance is essential for making informed decisions in optimizing PostgreSQL databases.
Best Practices for Informatica Performance Tuning with PostgreSQL
Informatica tool used for data integration, and PostgreSQL is an open-source relational database management system. Optimizing the performance of Informatica workflows that interact with a PostgreSQL database involves a combination of best practices for both Informatica and PostgreSQL. Here are some best practices:
Informatica Performance Tuning:
- Use Bulk Loading:
- Utilize bulk loading options provided by Informatica to load data in bulk, reducing the number of individual insert statements.
- Optimize Source and Target Queries:
- Ensure that the SQL queries generated by Informatica are optimized. Pay attention to indexes, filtering, and sorting in both source and target databases.
- Partitioning and Parallel Processing:
- Leverage partitioning in Informatica to process data in parallel.
- Configure session settings to allow multiple threads for parallel processing.
- Cache Management:
- Effectively use cache to store lookup and transformation data, especially for repeated lookups, to reduce database round trips.
- Configure cache sizes based on available system memory.
- Optimize Transformation Logic:
- Review and optimize transformation logic within Informatica mappings to reduce unnecessary computations and data movement.
- Use Pushdown Optimization:
- Leverage pushdown optimization to push processing down to the database level, reducing data movement between Informatica and the database.
- Session and Memory Configuration:
- Adjust session settings for buffer sizes, commit intervals, and memory allocation based on the available system resources.
- Monitor and tune the memory allocated to the Informatica server.
PostgreSQL Performance Tuning:
- Indexes and Statistics:
- Create appropriate indexes on columns used in WHERE clauses and joins.
- Regularly analyze and update statistics to help the query planner make informed decisions.
- Configuration Parameters:
- Adjust PostgreSQL configuration parameters, such as shared_buffers, work_mem, and effective_cache_size, based on the available system resources.
- Connection Pooling:
- Implement connection pooling to efficiently manage database connections and reduce the overhead of establishing new connections for each session.
- Table Partitioning:
- If dealing with large tables, consider table partitioning to improve query performance and simplify data management.
- Vacuum and Analyze:
- Regularly run the VACUUM and ANALYZE commands to reclaim storage and update table statistics.
- Write Efficient Queries:
- Optimize SQL queries by using appropriate joins, indexes, and WHERE clauses.
- Minimize the use of unnecessary subqueries.
- Monitoring and Logging:
- Implement monitoring tools to keep an eye on database performance.
- Analyze logs for slow queries and optimize them.
- Regular Database Maintenance:
- Perform routine maintenance tasks, including reindexing and optimizing queries, to keep the database in peak condition.
It’s essential to test performance changes in a controlled environment before applying them to a production system. Regular monitoring and periodic reviews of performance configurations will help maintain optimal performance over time. Additionally, collaboration between database administrators and ETL developers is crucial for successful performance tuning.

Case Studies: Real-life Examples of Successful Performance Tuning
- Real-life examples of successful performance tuning provide valuable insights and practical strategies for maximizing efficiency in Informatica with PostgreSQL database. These case studies showcase how organizations have identified and resolved performance bottlenecks, optimized workflows, and achieved significant improvements in processing time and resource utilization.
Case Study # 1
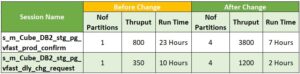
Problem statement: We have a session which is running for more than 23 hours with single partition.
Performance Improvement techniques implemented:
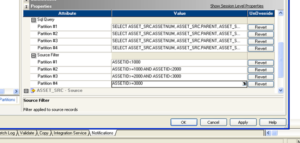
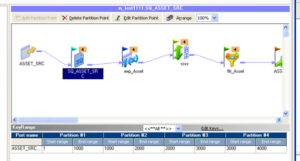
- Implemented Informatica pass through partitioning on incoming data
- Added 4 partition points at source qualifier
- Partitioned data based on Production_month number
- Increased target commit interval from default value 10K to 100K.
- Implemented stats gather operation at target database in PostgreSQL
- Enabled Bulk loading at target side which would disable logging in turn improve the performance.
- Used query tuning methods ANALYZE and EXPLAIN to pin down bottlenecks in the Query
- The target table is data loading mechanism is Truncate & Reload. So, we have disabled the indexes before data load and recreated the same indexes after data load.
- We have autovacuum option enabled and scheduled at database level to manage deletions across the database.
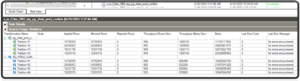
Results: Session completing in ~7 hours to load same amount of data.
Benefits:
- Early data availability to business
- Optimum utilization of Informatica and database resources
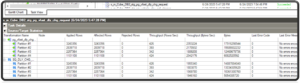
Implementation Snippets:
Results
Case Study # 2
Problem statement: Informatica Session is running for more than 9 hours with single partition.
Performance Improvement techniques implemented:
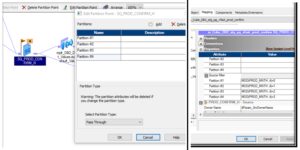
- Implemented Informatica pass through partitioning
- Added 4 partition points at source
- Partitioned data based on GROUP_ID
- Implemented Auto stats gather operation at target database in PostgreSQL
- Partitioned the data into multiple logically separated tables at database level instead of having one big table. This enabled parallel data loading at target database.
- Used query tuning methods ANALYZE and EXPLAIN to pin down bottlenecks in the Query
- Tuned the source query with proper joins and indexes
- The target table is data loading mechanism is Truncate & Reload. So, we have disabled the indexes before data load and recreated the same indexes after data load.
- We have autovacuum option enabled and scheduled at database level to manage deletions across the database.
Benefits:
- Early data availability to business
- Optimum utilization of Informatica and database resources
Case Study # 2—Results Session completed within ~2 hours to load data
Performance Tuning – Results Comparison
Conclusion:
To sum up, proficiency in ETL and database performance tuning is essential for maximizing operational efficiency. By applying strategies and insights drawn from real-life examples, organizations can address performance bottlenecks, streamline workflows, and realize substantial enhancements in processing time and resource utilization. Looking ahead, it remains crucial to maintain a continuous cycle of monitoring and fine-tuning performance to sustain ongoing efficiency gains. This proactive approach ensures that systems remain optimized and responsive to evolving demands.