

Integrating Snowflake with Grafana transforms data visualization by combining Snowflake’s robust data warehousing with Grafana’s dynamic dashboards. This integration offers real-time insights and streamlined data analysis, enhancing business intelligence capabilities for more informed decision-making.
What is Grafana?
Grafana is an open-source platform for monitoring and observability. It’s used to visualize and analyze metrics and logs from various data sources, allowing users to create dashboards for real-time monitoring and data analytics.
- Open Source: Grafana is freely available for all users to install, use and modify the software without any license fees.
- Data Visualization: It excels in creating detailed and interactive dashboards that visualize time-series data from various sources.
- Monitoring and Alerting: In addition to visualization Grafana offers monitoring and alerting capabilities that allows users to track their system activities and receive notifications.
Features of Grafana
- Wide Range of Data Sources: Grafana supports numerous data sources including relational databases (MySQL, PostgreSQL), time-series databases (Prometheus, InfluxDB), cloud services (AWS CloudWatch, Google Cloud Monitoring), and more.
- Customizable Dashboards: Users can create highly customizable dashboards with various types of panels such as graphs, tables, and heatmaps.
- Advanced Query Editor: Grafana provides a sophisticated query editor for each data source, enabling complex data queries and transformations.
- Alerting: Integrated alerting allows users to set up thresholds and receive notifications via email, Slack, and other communication channels.
- Templating and Variables: Dashboards can be made dynamic and reusable using template variables, making them adaptable to different environments and datasets.
- Plugins and Extensions: A rich ecosystem of plugins extends Grafana’s capabilities with additional panel types, data sources, and applications.
- User Management: Grafana supports user authentication and role-based access control, ensuring that only authorized users can access specific dashboards and data.
Integration of Snowflake with Grafana
To integrate Snowflake with Grafana, follow these steps:
Step 1: Install Snowflake plugin in Grafana
Grafana does not provide Snowflake as a default data source. You need to install the Snowflake plugin first and then add Snowflake as a data source. Log in to your Grafana cloud.
- Go to the Administration section in the navigation bar.
- Select “Plugins” under the “Plugins and data” section.
- Find and select the Snowflake plugin.
- Click on the “Install” button in the top right corner of the page.
- Navigation Path: Home → Navigation Bar → Administration → Plugins → Snowflake → Install
Step 2: Add Snowflake as a Data Source
- Go to “Connections” in the navigation bar.
- Select “Data Sources” under the “Connections” section.
- Create the data source by providing the necessary information.
- Navigation Path: Navigation Bar → Connections → Data Source → Add New Data Source
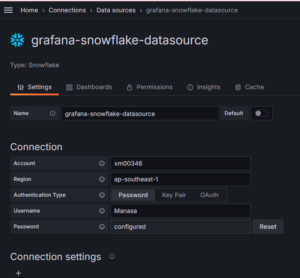
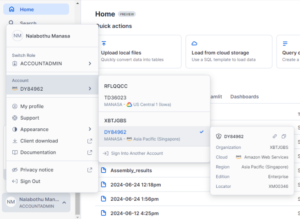
Note: The account name should not be your username but the name present in
the URL when accessing your Snowflake account details. It will be in the
format https://******.ap-southeast-1.snowflakecomputing.com,
where " ****** " is the account name and " ap-southeast-1 " is the region name.
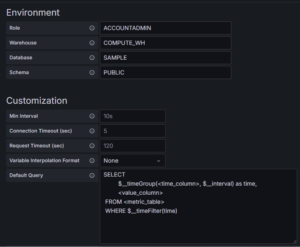
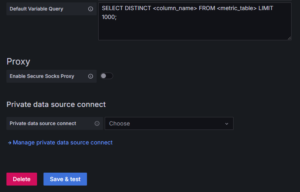
Provide your username, password, role, warehouse, database, schema, and test the connection. If the connection is successful, proceed to the next step.
Step 3: Creating a Dashboard
- Go to the “Dashboard” section in the navigation bar.
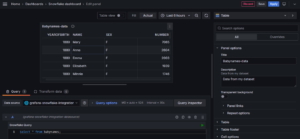
- Create a new dashboard and add a new visualization panel to query the Snowflake data.
- For example, you can use the “babynames” dataset and choose “Table” visualization.
SQL Query Example: SELECT * FROM babynames;
- Save your dashboard, give the panel a name, and add a description if needed.
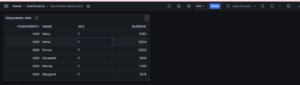
Once your dashboard and panel are saved and executed, you can see the data in your dashboard based on your query. You can expand and view the data by clicking on “View.”
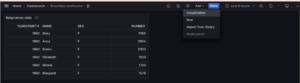
Adding Additional Panels:
- Click on “Add” to add a new panel and select a different visualization type.
- Query your data in the same dashboard to see multiple panels on the same page.
Example Queries and Visualizations:
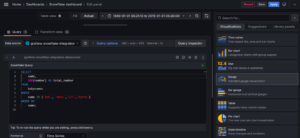
- Time Series: To get count of each specified name by year
SELECT
    TO_DATE(yearofbirth::VARCHAR, 'YYYY') AS time,
    name,
    SUM(number) AS total_number
FROM
    babynames
WHERE
    name IN ('Bob', 'Mary','Jack','Elizabeth')
GROUP BY
    name, yearofbirth
ORDER BY
    time ASC, name;
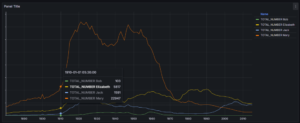
We can customize our graph by changing the parameters as per our requirement.
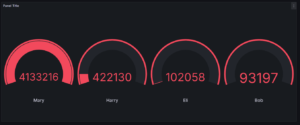
- Gauge Visualization: To get count of each specified name by year
SELECT
    name,
    SUM(number) AS total_number
FROM
    babynames
WHERE
    name IN ('Bob', 'Mary','Eli','Harry')
GROUP BY
    name;
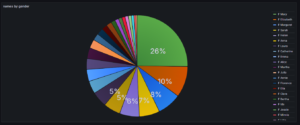
- Pie Chart: To find the total number of occurrences for each baby name by sex.
select sex,name,sum(number) as total_number
from babynames
group by sex,name;
This is the pie chart representation of the query containing the name, sex, number and percentage.
In this way, you can integrate Snowflake with Grafana and visualize Snowflake data using SQL queries.